Overview
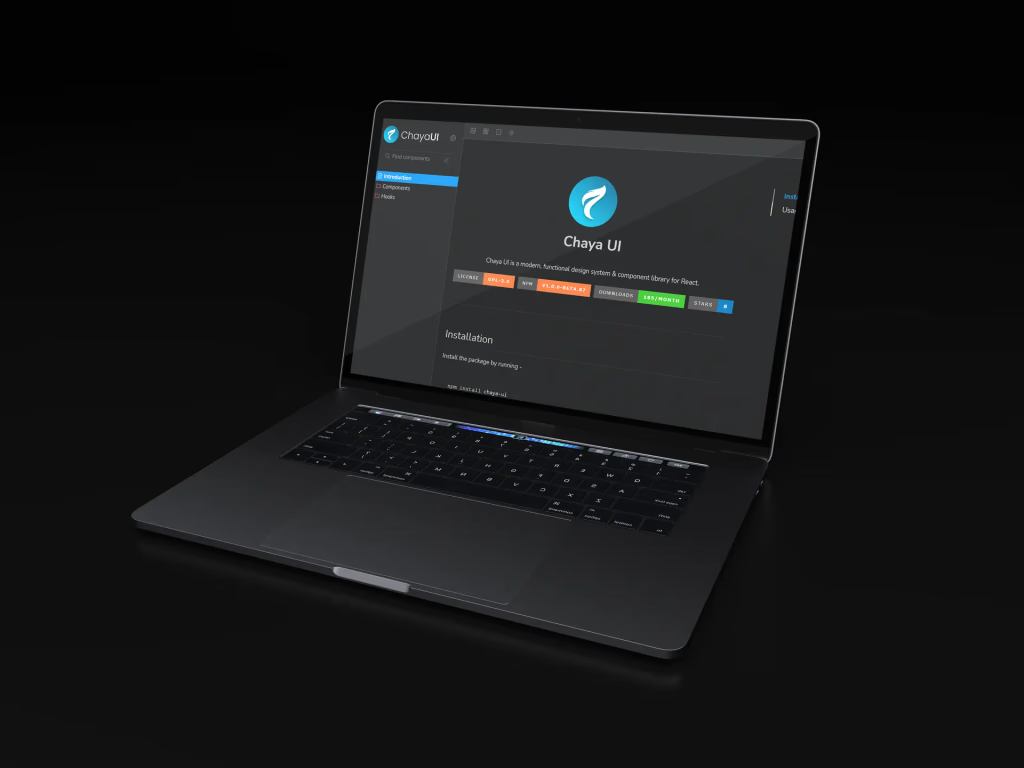
Chaya UI is Traboda's open-source component library for React, built so teams can ship SaaS applications with less code. It's documented in Storybook and open-sourced under GPL-3.0, and it's one of the projects where I worked alongside the people who created it, on design as well as code.
The library was started by Traboda's team in 2022; most of its code is theirs. My merged contributions are focused on two components, the DataTable and the Breadcrumb, described below.
The Philosophy
Chaya's documentation opens with its principles, and they explain most of the design decisions inside it.
| Principle | What it means in practice |
|---|---|
| The best developer experience | Less code downstream, minimal boilerplate, no surprises |
| Data-first, no compositions | Components take lists and objects directly, without wrapper components or mapping |
| The best ingredients | TypeScript, Tailwind CSS, Radix primitives, and class-variance-authority |
| Maximum flexibility | Variants, props, and theming |
| Do the heavy lifting | Accessibility, responsiveness, and performance built in |
| Follow the standard | Names and props consistent with libraries like Chakra UI and Mantine |
Data-first is the one that matters most for a component like the DataTable: you hand it your rows and a column definition, and it renders, sorts, and styles them.
What's in the Library
The library covers what a SaaS dashboard needs, with display and input components making up most of it.

My Contribution: Readable Tables
Data tables are where dashboards live or die. Long rows of similar values are hard to scan, so the DataTable supports striping, and my first pull request reworked how striped rows and columns are coloured so the bands stay visible without fighting the content, including the theme colours in the Tailwind config.


| Pull request | What changed |
|---|---|
| Fixed the rows and columns colours (#120) | Striped row and column colours in the DataTable, its stories, and the Tailwind theme |
| Changes in the title bar (#121) | The DataTable's title bar and row styling |
| Table colour (#122) | The Breadcrumb component and its stories |
The Title Bar
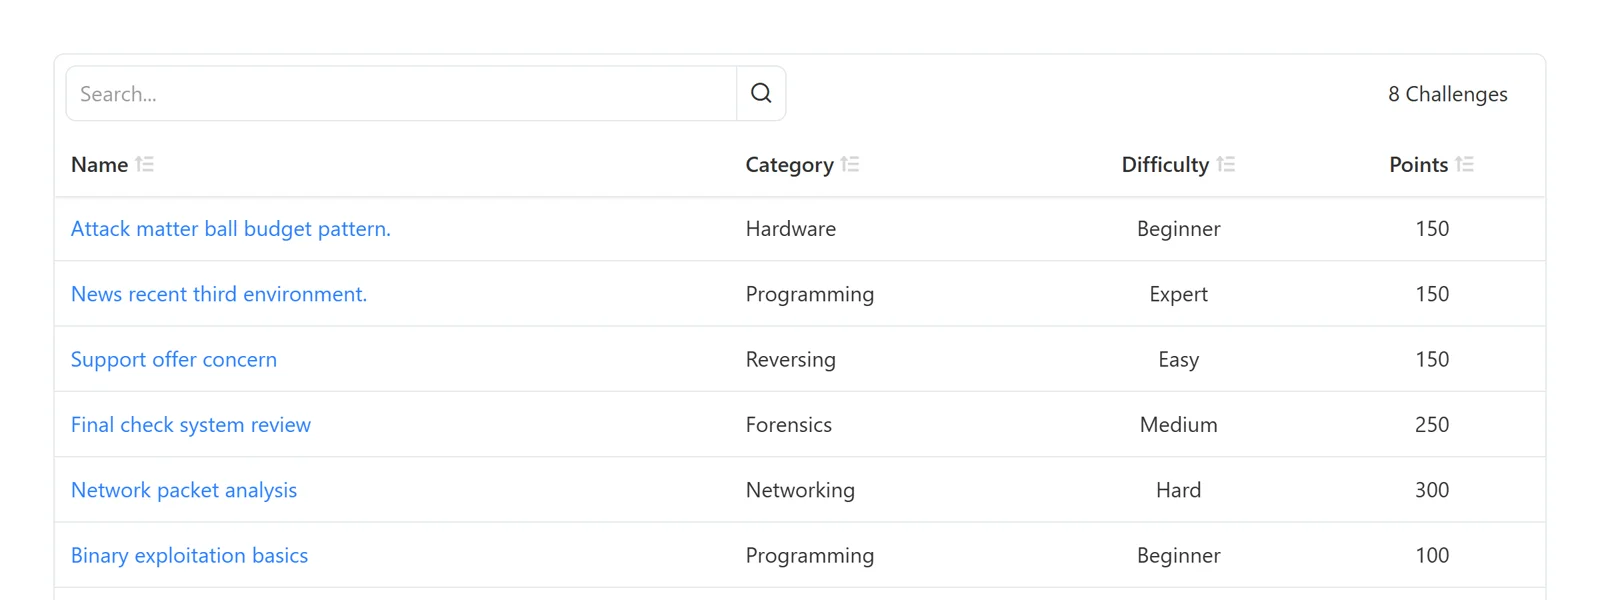
A table in a real product rarely stands alone: it needs a title, a search box, and a count. The DataTable's title bar holds those, and my second pull request reworked its layout and how it sits on top of the rows.
| Part | Job |
|---|---|
| Search box | Filter rows without leaving the table |
| Count | Tells you how much is there, and how much matches |
| Column headers | Sortable, with a quiet sort icon |
| Rows | Links stay blue; everything else stays neutral |
What I Took From It
| Lesson | Why |
|---|---|
| Small changes in a shared system travel far | A row colour in a library shows up in every product that uses it |
| Stories are the spec | Each change came with its Storybook stories, so reviewers could see it, not just read it |
| Follow the system's principles | Data-first meant changing styling without changing how people pass in data |
The library and its documentation are at chaya.traboda.com, and the code is on GitHub.